
Introduction to Power BI
Power BI is a business intelligence and analytics platform developed by Microsoft that helps organizations transform raw information into meaningful insights. Businesses across industries rely on Power BI to analyze data, create dashboards, generate reports, and support strategic decision-making. The platform is widely recognized because it simplifies complex data analysis and allows users to visualize trends in a user-friendly format.
Modern organizations generate huge amounts of information every day. Managing spreadsheets manually is no longer enough for companies that need real-time insights. Power BI solves this challenge by connecting multiple data sources into one centralized reporting environment. Whether a company needs sales reports, operational dashboards, marketing analytics, or financial forecasting, Power BI offers a flexible solution.
Businesses use Power BI because it combines data visualization, cloud integration, and advanced analytics into one platform. It supports both technical users and non-technical professionals. Executives can review dashboards quickly, while analysts can build advanced reports with detailed metrics and calculations.
What Is Power BI?
Power BI is a cloud-based business analytics tool that helps organizations collect, process, and visualize information. The platform connects with databases, Excel files, APIs, cloud services, and enterprise applications. Users can then create reports and dashboards to monitor performance indicators and identify patterns.
The platform includes several components such as Power BI Desktop, Power BI Service, Power BI Mobile, and Power BI Report Server. Each component supports different use cases. Power BI Desktop is mainly used for report creation, while Power BI Service enables sharing and collaboration across teams.
One of the main strengths of Power BI is its integration with the Microsoft ecosystem. Organizations using Excel, Azure, Dynamics 365, or Microsoft Teams can integrate Power BI seamlessly into existing workflows.
Main Uses of Power BI
Power BI is used in many ways across organizations. Companies rely on the platform for data visualization, reporting, business intelligence, forecasting, operational monitoring, and strategic planning.
- Creating interactive dashboards
- Analyzing sales and revenue trends
- Monitoring operational performance
- Generating financial reports
- Tracking marketing campaigns
- Forecasting business growth
- Monitoring customer behavior
- Managing inventory and logistics
- Supporting data-driven decisions
- Automating reporting processes
Power BI for Data Visualization
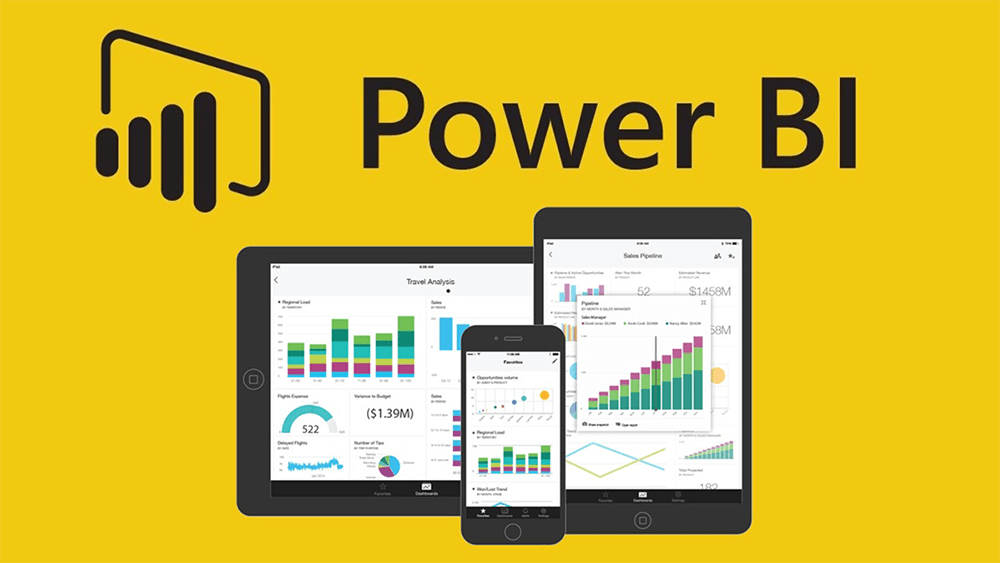
Data visualization is one of the most important uses of Power BI. Businesses often struggle to understand large datasets when information is presented in rows and columns. Power BI transforms raw numbers into charts, graphs, maps, and dashboards that are easier to interpret.
Organizations use visual reports to identify sales trends, customer preferences, and operational inefficiencies. Visual dashboards make it easier for management teams to monitor company performance without reviewing lengthy spreadsheets.
Interactive visualizations also improve communication between departments. Marketing teams, sales managers, finance professionals, and executives can all review the same dashboards and collaborate more effectively.
Power BI for Business Intelligence
Business intelligence refers to the process of analyzing information to improve decision-making. Power BI is widely used as a business intelligence platform because it consolidates information from different systems into a unified environment.
Organizations often store data across multiple platforms such as CRM software, ERP systems, spreadsheets, and cloud applications. Power BI connects these sources and creates centralized reporting systems. This allows businesses to monitor performance metrics in real time.
Executives use Power BI dashboards to review business health indicators such as revenue growth, profit margins, operational costs, and customer retention rates. Managers can then make informed decisions based on accurate insights.
Power BI for Reporting
Power BI simplifies reporting by automating repetitive tasks. Traditional reporting methods often involve manual spreadsheet preparation, which consumes time and increases the risk of errors.
With Power BI, businesses can automate report generation and schedule updates. Reports can refresh automatically whenever new information becomes available. This ensures that teams always work with current data.
Reports can also be customized for different departments. Sales teams may focus on revenue metrics, while finance teams analyze budgets and profitability. The flexibility of Power BI allows organizations to create personalized reporting systems.
Power BI for Real-Time Analytics
Real-time analytics helps organizations respond quickly to changing conditions. Power BI supports real-time dashboards that update continuously as new information enters the system.
Retail businesses can track live sales performance, logistics companies can monitor deliveries, and customer service departments can review support metrics instantly. Real-time insights allow organizations to solve problems faster and improve efficiency.
This capability is especially valuable in industries where rapid decision-making is critical. Companies can identify operational disruptions immediately and take corrective action before issues escalate.
Power BI for Financial Analysis
Financial departments use Power BI to monitor budgets, expenses, revenue, and profitability. Interactive dashboards help finance professionals analyze trends and compare historical performance.
Power BI supports forecasting and predictive analytics, enabling businesses to plan future financial strategies more effectively. Companies can identify cost-saving opportunities and monitor cash flow in real time.
Finance teams also benefit from automated reporting because it reduces manual calculations and improves accuracy.
Power BI for Marketing Analytics
Marketing teams rely on Power BI to measure campaign performance and customer engagement. Businesses can track website traffic, social media performance, advertising ROI, and customer acquisition metrics.
Power BI dashboards help marketers understand which campaigns generate the best results. This allows organizations to allocate budgets more efficiently and optimize marketing strategies.
By analyzing customer behavior, companies can create more personalized marketing campaigns and improve audience targeting.
Power BI for Sales Performance
Sales departments use Power BI to track revenue, monitor team performance, and analyze customer purchasing behavior. Sales dashboards provide detailed insights into regional performance, product demand, and conversion rates.
Managers can compare sales targets with actual performance and identify areas requiring improvement. This visibility supports better planning and stronger sales strategies.
Organizations also use predictive analytics to forecast future sales trends and adjust inventory or staffing accordingly.
10 Practical Examples of Power BI Usage
1. Retail Sales Dashboard
Retail companies use Power BI to monitor daily sales, product performance, and customer purchasing trends across multiple locations.
2. Healthcare Analytics
Hospitals use Power BI to track patient records, operational efficiency, and treatment outcomes.
3. Financial Reporting
Banks and finance companies use Power BI for budget tracking, profitability analysis, and risk management.
4. Manufacturing Operations
Manufacturers monitor production efficiency, machine performance, and supply chain metrics using Power BI dashboards.
5. Marketing Campaign Tracking
Digital marketing agencies analyze ad performance, click-through rates, and campaign ROI with Power BI.
6. Human Resources Analytics
HR departments use Power BI to monitor employee performance, hiring trends, and workforce productivity.
7. Logistics Monitoring
Transportation companies track shipments, fuel usage, and delivery performance in real time.
8. Educational Reporting
Educational institutions analyze student attendance, academic performance, and enrollment statistics.
9. Customer Service Analytics
Support teams use Power BI to track response times, customer satisfaction, and service quality.
10. E-commerce Performance
Online stores monitor website traffic, customer behavior, conversion rates, and product demand through Power BI dashboards.
Advantages of Using Power BI
- Easy integration with Microsoft products
- Interactive and user-friendly dashboards
- Cloud-based accessibility
- Automated reporting features
- Real-time data monitoring
- Advanced analytics capabilities
- Mobile accessibility
- Scalable solutions for businesses
- Secure data management
- Customizable reporting options
Challenges of Power BI
Although Power BI offers many advantages, businesses may face challenges during implementation. Large datasets can sometimes affect performance, especially if reports are not optimized properly.
Organizations also need skilled professionals who understand data modeling, visualization techniques, and report design. Without proper planning, dashboards can become overly complex and difficult to interpret.
Another challenge involves data governance. Companies must ensure that information is accurate, secure, and compliant with industry regulations.
How Businesses Benefit from Power BI
Businesses benefit from Power BI because it improves operational visibility and supports faster decision-making. Instead of relying on static reports, organizations can access dynamic dashboards that update automatically.
Power BI also improves collaboration between departments by providing centralized access to insights. Teams can work together more effectively when everyone has access to consistent information.
The platform reduces reporting time, improves efficiency, and supports long-term strategic planning.
Future of Power BI
The demand for data analytics continues to grow, and Power BI remains one of the leading business intelligence platforms in the market. Microsoft regularly updates the platform with new AI-driven analytics features, cloud integrations, and automation tools.
Future developments may include stronger predictive analytics, improved natural language processing, and enhanced integration with machine learning systems. Businesses that adopt Power BI early can gain a competitive advantage through data-driven decision-making.
Conclusion
Power BI is a powerful business intelligence and analytics platform that helps organizations transform data into actionable insights. Companies use it for reporting, visualization, forecasting, operational monitoring, and decision-making.
The platform supports multiple industries including finance, healthcare, retail, manufacturing, logistics, education, and marketing. By simplifying complex information and automating reporting processes, Power BI improves productivity and business performance.
As businesses continue to prioritize data-driven strategies, Power BI will remain an essential tool for organizations seeking better insights, improved efficiency, and long-term growth.
Frequently Asked Questions
What is Power BI mainly used for?
Power BI is mainly used for business intelligence, reporting, analytics, and data visualization.
Is Power BI suitable for small businesses?
Yes, Power BI is suitable for small businesses because it offers scalable analytics solutions at affordable pricing levels.
Can Power BI connect with Excel?
Yes, Power BI integrates directly with Excel and other Microsoft products.
Does Power BI support real-time reporting?
Yes, Power BI provides real-time dashboards that update automatically as new information becomes available.
Is Power BI difficult to learn?
Power BI is considered beginner-friendly compared to many analytics platforms, although advanced features require technical knowledge.
Can Power BI be used on mobile devices?
Yes, Power BI offers mobile applications for Android and iOS devices.
What industries use Power BI?
Industries such as healthcare, finance, retail, manufacturing, logistics, education, and marketing commonly use Power BI.
Does Power BI require coding knowledge?
Basic Power BI usage does not require coding knowledge, but advanced analytics may involve DAX and Power Query.
What is a Power BI dashboard?
A Power BI dashboard is a visual interface that displays charts, graphs, and reports for monitoring business performance.
Why is Power BI popular?
Power BI is popular because it combines powerful analytics, interactive dashboards, cloud integration, and ease of use.